Is this financial advice?
▾
No. TCG Quant is an informational tool that tracks quantitative supply and demand signals based on publicly available eBay data. Nothing on this platform constitutes financial, investment, or trading advice. Past signal performance does not guarantee future results. Always conduct your own research before making any purchase decisions.
How often is the data updated?
▾
Pricing updates daily via TCGPlayer for all products. Supply and demand signals (eBay listings, DSR, inventory days) update weekly for Booster Boxes, Booster Bundles, ETBs, and PC ETBs. PSA grading population data covers 55 sets and is refreshed periodically. Legacy and monthly products use a price momentum model.
What does an 81.6% hit rate actually mean?
▾
Out of 402 historical signals tracked, 81.2% correctly identified a set that was in active supply contraction — meaning prices held or appreciated over the following 4 weeks. The average gain across resolved signals is measured at 4 and 8 week intervals. All pricing data is sourced from eBay and TCGPlayer, updated daily.
What markets does TCG Quant cover?
▾
We currently track 143 sealed TCG products: Pokémon (SV + SWSH Booster Boxes, Booster Bundles, all ETB variants, SM Era, XY Era, Ultra Premium Collections, Super Premium Collections) and One Piece (Booster Boxes OP-01 through OP-16 plus Extra Boosters and Premium Boosters). All pricing data is sourced from eBay sold listings and TCGPlayer.
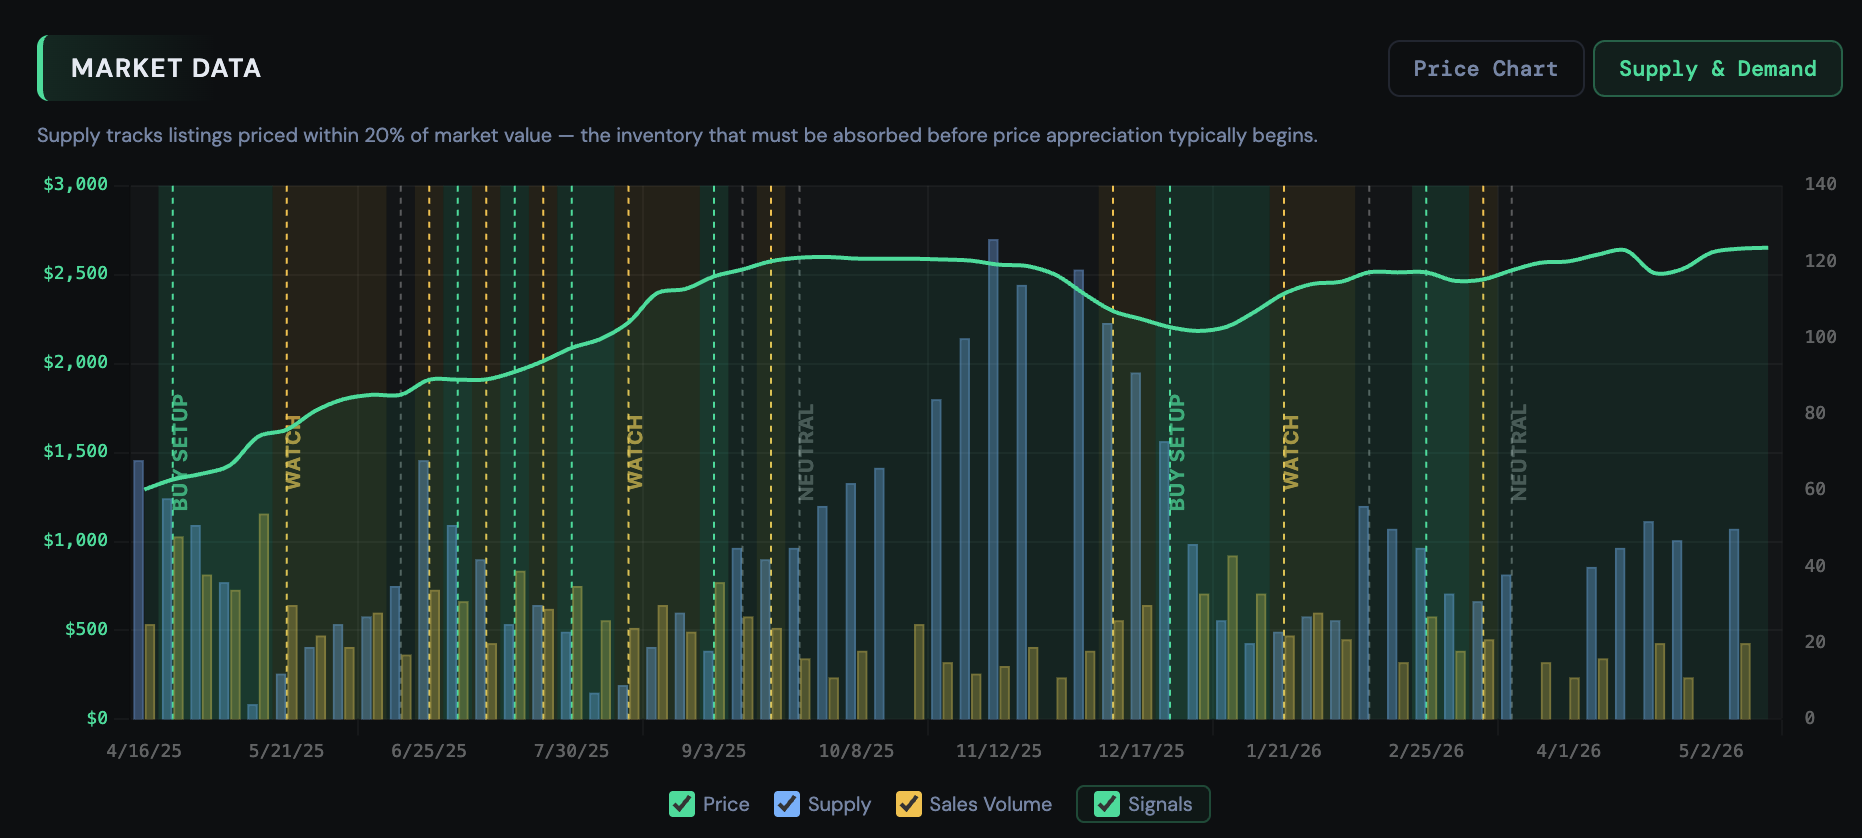
What's the difference between BUY SETUP, WATCH, and NEUTRAL?
▾
BUY SETUP means all 3 supply contraction conditions are met simultaneously: DSR trending up, supply down 10%+ over 4 weeks, and inventory below 25 days. WATCH means 2 of 3 conditions are met — the setup is developing but not fully formed. NEUTRAL means fewer than 2 conditions are met with no clear signal at this time.
Why do you use eBay data? What about TCGPlayer?
▾
eBay is the primary data source for all products because it represents the largest and most liquid secondary market for sealed TCG products, with the highest volume of completed sales. This gives us the most accurate real-time price discovery and reliable supply counts. The one exception is One Piece sealed cases — because case-level sales are extremely thin on eBay, we pull pricing data from TCGPlayer for that product type, which has better coverage of the case market. All other signals (Pokémon Booster Boxes, ETBs, Legacy Sets, UPCs, and One Piece Booster Boxes) use eBay sold listings exclusively.
What is the Destruction Tracker?
▾
The Destruction Tracker estimates how much sealed supply has been permanently removed from the market through box openings. When collectors open packs and submit cards to PSA for grading, those sealed boxes are gone forever. We track PSA population data across 55 sets to estimate the number of packs, boxes, and cases consumed. Higher destruction = less sealed supply remaining = stronger long-term price support.
What is the Set Explorer?
▾
The Set Explorer is a research tool that lets you deep-dive into any set across Pokémon and One Piece. It shows chase card pricing, pull rates, market data charts, supply and demand metrics, PSA grading activity, and Long-Term Thesis (LTS) scores. Browse by era or search for any set to see the full picture before making buying decisions.
What is the LTS (Long-Term Thesis) score?
▾
The LTS is a 0–10 investment thesis rating for each set based on four factors: IP desirability (how iconic the Pokémon or characters are), chase card significance (value concentration in top pulls), print run scarcity (how limited the supply is), and historical price performance. Scores of 9+ are rated Generational, 7+ Strong, and 4+ Moderate. LTS complements the short-term supply/demand signals with a longer-term view of a set's investment quality.
Can I cancel my premium subscription?
▾
Yes — you can cancel anytime from your account page. No contracts, no annual commitment required. If you cancel, you'll retain premium access through the end of your current billing period.